
Welcome!
Hello and thank you for visiting my portfolio. Explore my projects and feel free to reach out!
About Me
Hello! I'm Geovane Gomes, also known as Gigio.I'm a data professional with over seven years of experience in the logistic and transportation industry. With a background in STEM, I bring a unique perspective to data analysis and interpretation. My goal is to harness the power of data to drive meaningful insights and inform strategic decision-making. Whether it's uncovering trends, optimizing processes, or developing predictive models, I'm dedicated to delivering impactful solutions through data-driven approaches.
Skills


Certifications

MO-210 - Microsoft Office Specialist: Excel Associate

PL-300 - Microsoft Certified: Power BI Data Analyst Associate
Projects
Traveling Salesman Probem
The Traveling Salesman Problem (TSP) is a classic optimization problem in which a salesman must visit a set of cities exactly once and return to the starting point, with the goal of minimizing the total travel distance or cost. In this project, the TSP is applied to the Região Metropolitana do Vale do Paraíba e Litoral Norte (RMVPLN).
Modeling and Forecasting Container Throughput at the Port of Santos Using Statistical Time Series Models
This study aims to analyze the time series of container cargo throughput at the Port of Santos to identify trends, seasonality, and patterns in port activity. Additionally, the study aims to perform forecasting to predict future throughput and provide insights for terminals, shippers, authorities and other stakeholders.
Transportation Cost Minimization
This project aims to implement a model that minimizes the total transportation costs incurred by the company in delivering products from its 2 factories to its 3 distribution centers.
Optimized Fuel Allocation
This project aims to optimize the allocation of fuel in tanks using Excel's Solver. The goal is to minimize shortage costs while meeting specific constraints, such as tank capacity and demand requirements.
Market share of Container Terminals in the Port of Santos
Animation that shows the market share of container port terminal in the Port of Santos.
Contact
Market Share of Container Terminals in Santos

The port of Santos is the largest in Latin America and handled more than 147 Million tons in 2021, 35% which in containerized cargo.Unlike other ports in Brazil, where only one port operator acts in this market, in Santos there is a great competition among the container terminals.This project offers a dynamic visualization of the market share evolution of container terminals in the port of Santos, Brazil. Using R programming with libraries such as tidyverse, ggplot2, and gganimate, viewers can observe the shifting market positions of terminals over the years through an animated timeline. The data for this visualization is public and available on Santos Port Authority website.For access to the code and files, please visit my GitHub repository.
Optimized Fuel Allocation
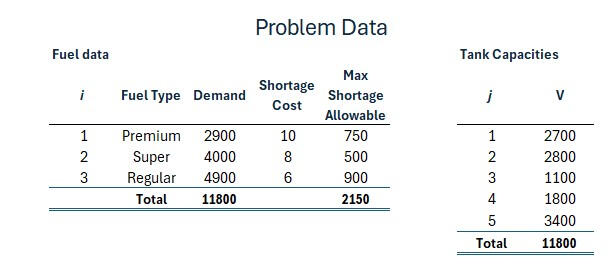
A tanker truck has five compartments, (j = 1, 2, ..., 5), with capacities Vj = 2,700, 2,800, 1,100, 1,800 and 3,400 gallons, respectively, totaling 11,800 gallons.
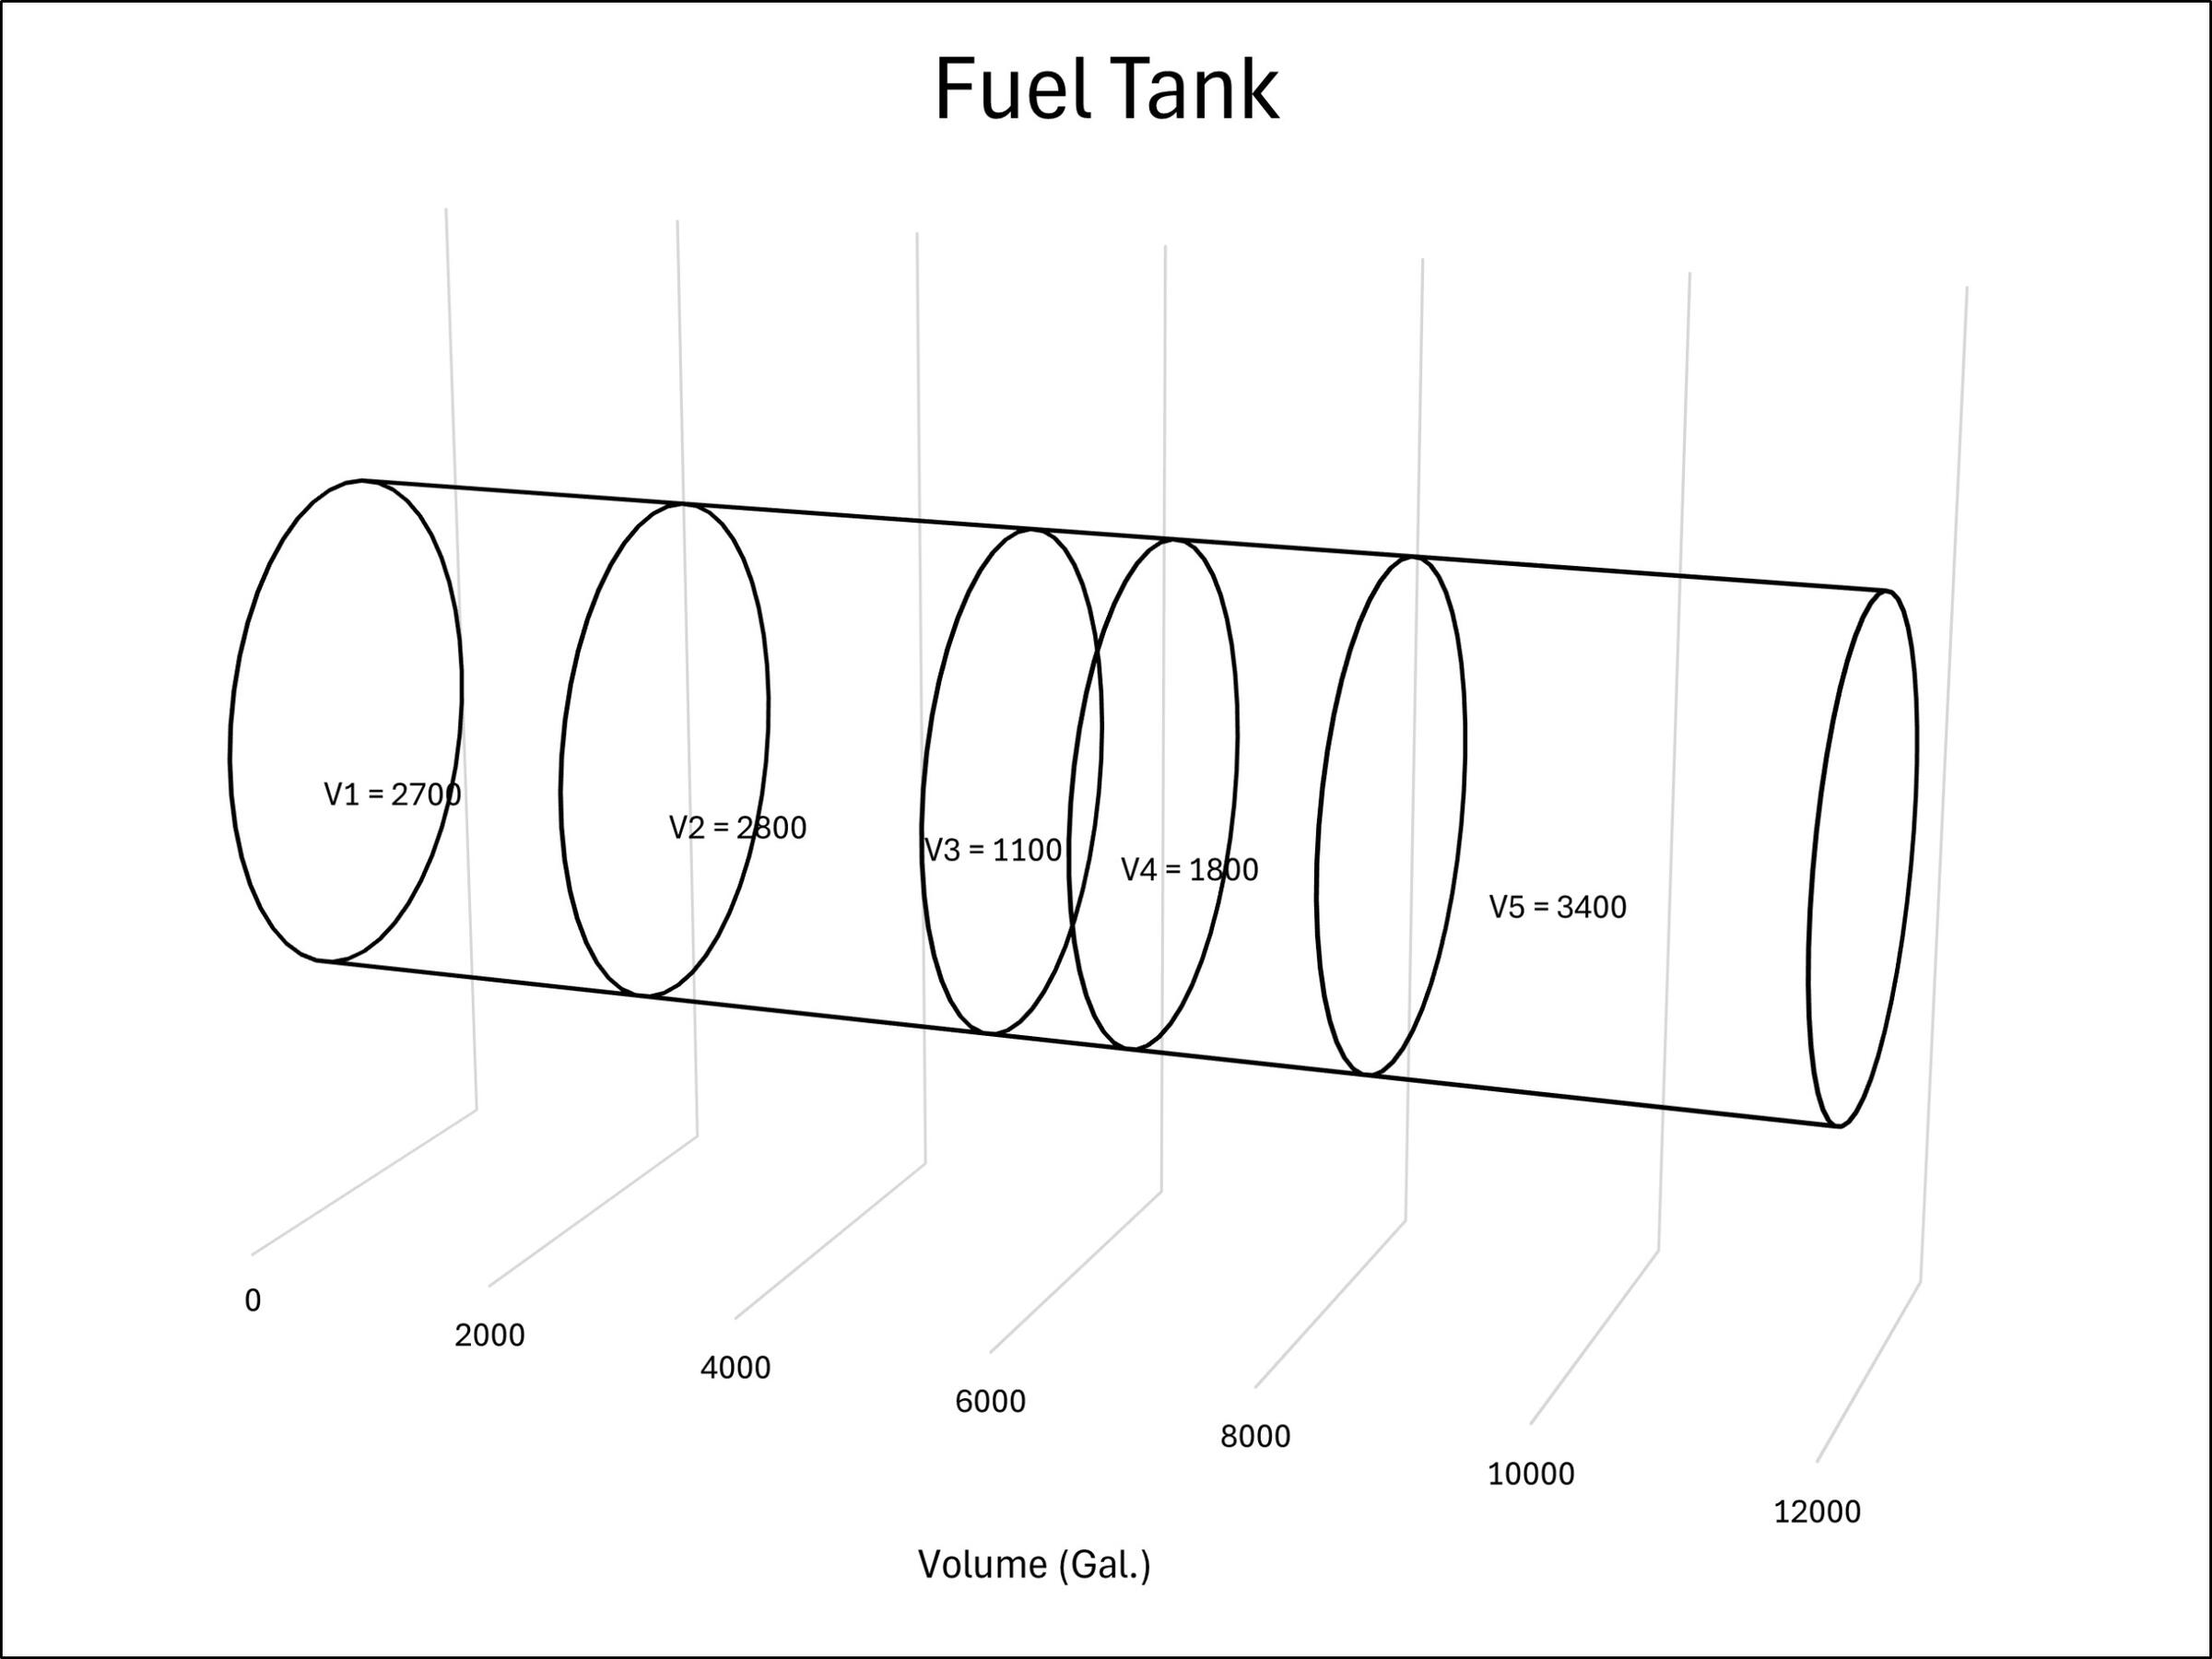
The company needs to deliver three types of fuel (i = 1, 2 and 3), which are premium, super and regular, respectively, with a combined demand of 11,800 gallons. This demand, however, will not be met, since each compartment in the tank can only carry one type of fuel.The objective is to optimize the allocation of fuel in order to minimize the shortage costs while meeting the maximum allowable shortage requirements as follows:
| Fuel | Demand (Gal.) | Shortage Cost ($ / Gal.) | Max Shortage Allowable (Gal.) |
|---|---|---|---|
| Premium | 2,900 | 10 | 750 |
| Super | 4,000 | 8 | 500 |
| Regular | 4,900 | 6 | 900 |
| Total | 11,800 | 2,150 |
Design Variables
The problem has 18 design variables, 15 of which are binary and 3 have real values:
xi, fuel shortage;
yij = 1, if the fuel i will be stored in the compartment j, and yij = 0, otherwise.
Objective Function
The objective is to minimize the fuel shortage x, weighted by its associated cost C. Thus, the objective function is f = ΣxiCi = 10x1 + 8x2 + 6x3.
Constraints
There are eleven constraints in the problem:
Σyij ≤ 1, each compartment can contain at most one type of fuel.;
0 <= xi ≤ Shortmax i, the shortage of each fuel type should not exceed the maximum allowable shortage.
Solution
The problem is classified as a Mixed Integer Linear Programming (MILP) problem, once we are dealing with linear objective function and constraints, and the decision variables are a mix of real and binary values.Excel's Solver is used to solve the problem, naming the cells range properly and adopting the LP Simplex algorithm as follows:
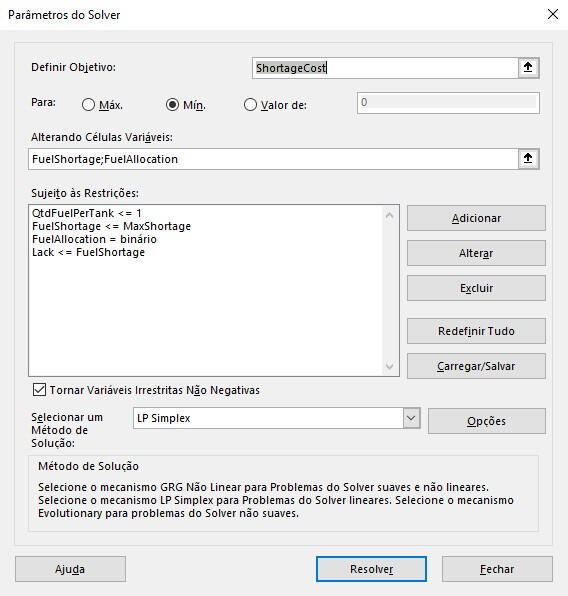
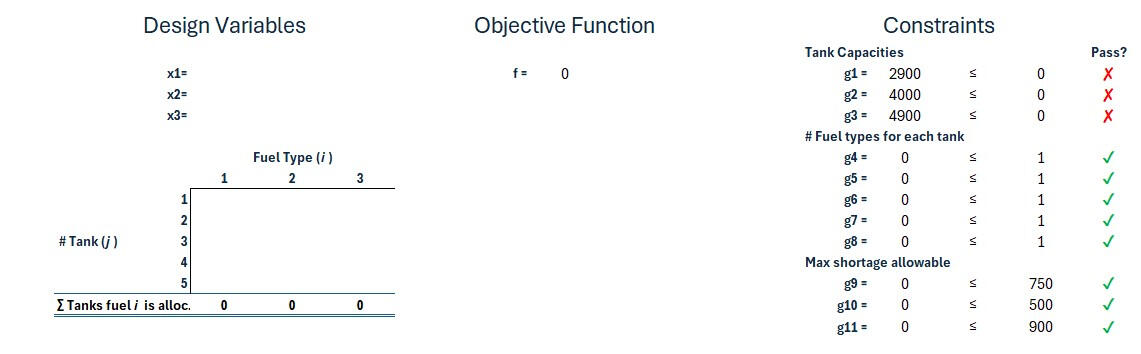
Here we see the problem parameters:
And the optmization problem before running the algorithm:
After running the solver, we got the optimized allocation to minimize the objective function (ShortageCost):
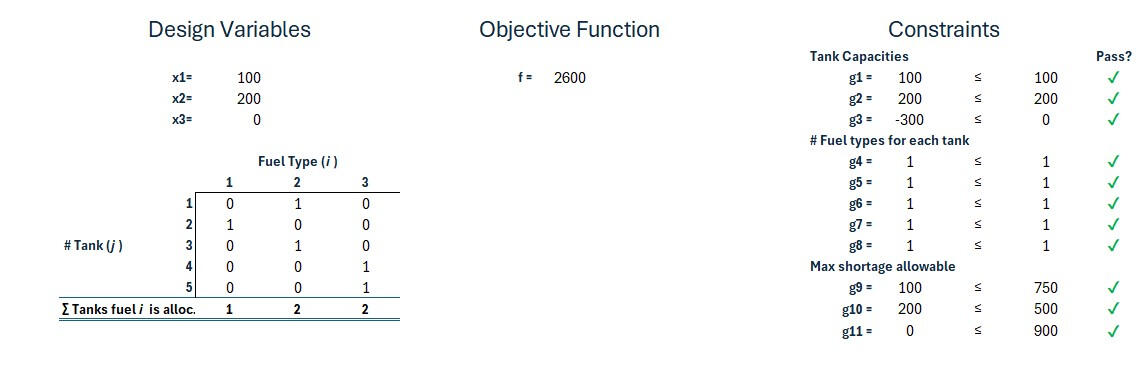
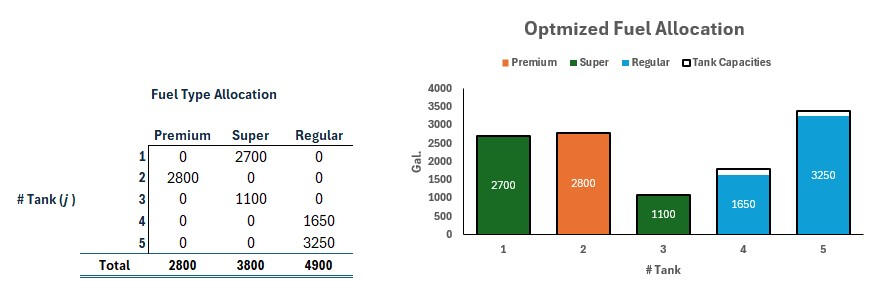
Therefore, the company should allocate the fuel as follows:
| # Tank | Fuel Type |
|---|---|
| 1 | Super |
| 2 | Premium |
| 3 | Super |
| 4 | Regular |
| 5 | Regular |
The minimum shortage cost is $ 2,600, with the fuel shortage as follows:
| Fuel Type | Shortage (Gal.) |
|---|---|
| Premium | 100 |
| Super | 200 |
| Regular | 0 |
The fuel quantity allocate in each tank can be calculated using the following expression in the formula bar:

Obtaining the following result:

Note that if overdelivery is not desirable, we can calculate the fuel quantity allocation using the following expression:

So we get:
This problem can be adapted by changing the parameters to minimize shortage cost for any scenario. The .xlsx file is available on my github repository.
Message Sent Successfully!
Thank you for reaching out! Your message has been sent and will be responded to shortly. We appreciate your interest and will do our best to get back to you as soon as possible.In the meantime, feel free to explore more about my work here.Best regards,
Geovane Gomes (Gigio)